히스토그램 역투영
히스토그램 역투영은 물체의 모양은 무시하고 단순히 컬러 분포만으로 검출하는 방법이다. 이를 이용해 사람의 얼굴을 검출할 수 있다. 이때 히스토그램은 명안 채널만 이용하는 1차원이 아니라, 최소 2차원 이상을 사용해야 한다. 명안은 조명에 따라 쉽게 변할 뿐만 아니라 얼굴과 비슷한 명암을 갖는 다른 영역이 여러 군데 존재할 가능성이 높아, 명안만 사용하면 피부에 해당하는 영역을 구별하기 어렵다. 따라서 RGB 색상 공간을 HSI 공간으로 변환한 다음, H(색상, Hue)와 S(채도, Saturation) 채널을 사용한다. histogram의 역투영은 다음과 같이 계산된다.
\[h_{r}(i,j)=min(\frac{\hat{h}_{m}(i,j)}{\hat{h}_{i}(i,j)},0,1) \ , 0 \le j \ , \ i \le q-1\]여기서 \(\hat{h}_{m}\)은 얼굴 색상을 추출한 정규화된 히스토그램이고 \(\hat{h}_{i}\)은 타겟의 정규화된 히스토그램이다. L의 크기가 클수록 (픽셀의 최대 값) 매우 희소한 공간에 존재하기 때문에 q단계로 줄여서 한다. 식을 이해해 보자면 \(\hat{h}_{m}\)이 \(\hat{h}_{i}\) 이상인 영역을 나타내는 것이다.
코드구현
이번 예제는 다음 두 사진을 이용해서 한다. 왼쪽 그림에서 얼굴에 해당하는 히스토그램을 추출하고 오른쪽그림에 역투영을 적용한다.
import numpy as np
import cv2
import matplotlib as mpl
from mpl_toolkits.mplot3d import Axes3D
import matplotlib.pyplot as plt

img = cv2.imread('./data/kim.jpg')
img2 = cv2.imread('./data/girlsgeneration.JPG')

plt.subplot(121)
plt.imshow(cv2.cvtColor(img,cv2.COLOR_BGR2RGB))
plt.subplot(122)
plt.imshow(cv2.cvtColor(img2,cv2.COLOR_BGR2RGB))
plt.show()
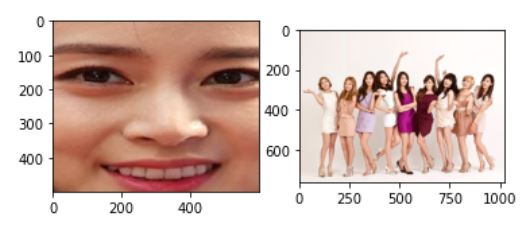
우선 먼저 RGB에서 HSI 색상 영역으로 변환하는 함수를 작성한다. (HSI2RGB는 이곳)
def rgb_to_hsi(img):
    heigh,width,channel = img.shape
    img_flat = np.reshape(img.copy(),[-1,channel])/255
    i = np.mean(img_flat, -1, keepdims=True)
    if channel==1:
        h = np.zeros_like(img_flat[...,2])
        s = np.zeros_like(img_flat[...,2])
    else:
        r = img_flat[...,2]
        g = img_flat[...,1]
        b = img_flat[...,0]
        mins = np.min(img_flat,axis=1,keepdims=True)
        s = 1-mins/i
        theta = np.arccos(((r-g)+(r-b))/(np.sqrt((r-g)**2+(r-b)*(g-b))*2))* 180 / np.pi
        h = np.expand_dims(np.where(b>g,360-theta,theta),-1)
        h/=360
    hsi = np.concatenate([h,s,i],-1)
    return np.uint8(np.clip(np.reshape(hsi,[heigh,width,channel])*255,0,255))

hsi = rgb_to_hsi(img)
0~255의 값을 가지므로 L은 현재 256, 이 공간을 줄이기 위해 q는 64 정도로 설정하고 히스토그램을 구하자. H 채널과 S 채널, 그리고 3차원 공간에서 히스토그램을 보면 다음과 같다.
L=256
q=64

hs_hist = np.zeros((q,q),np.float)
h_hist = np.zeros((q,1),np.int)
s_hist = np.zeros((q,1),np.int)

src_height, src_width ,_ = img.shape

hsi_flat = np.reshape(hsi.copy(),[-1,3])
for i in range(len(hsi_flat)):
    hs_hist[int(hsi_flat[i,0]*q/L)][int(hsi_flat[i,1]*q/L)]+=1
    h_hist[int(hsi_flat[i,0]*q/L)]+=1
    s_hist[int(hsi_flat[i,1]*q/L)]+=1

hs_hist=hs_hist/(src_width*src_height)

x = np.arange(q)
y = np.arange(q)
xx,yy = np.meshgrid(x,y)

plt.subplot(121)
plt.bar(x,h_hist.squeeze())
plt.xlim([0,q])
plt.subplot(122)
plt.bar(x,s_hist.squeeze())
plt.xlim([0,q])

fig = plt.figure()
ax = fig.gca(projection='3d')
ax.plot_surface(xx,yy,hs_hist.squeeze())

plt.show()
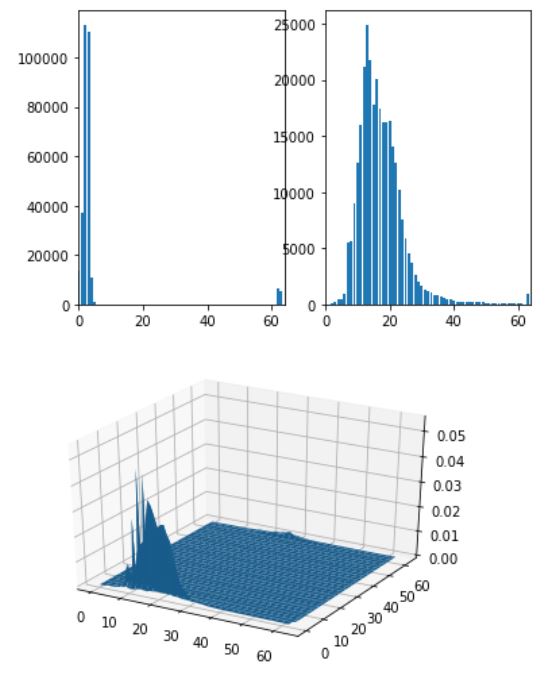
이제 타깃에서도 마찬가지로 히스토그램을 구한다.
dst_height,dst_width,_ = img2.shape
dst_hs_hist = np.zeros((q,q),np.float)
dst_hsi = rgb_to_hsi(img2)
hsi_flat = np.reshape(dst_hsi.copy(),[-1,3])

for i in range(len(hsi_flat)):
    dst_hs_hist[int(hsi_flat[i,0]*q/L)][int(hsi_flat[i,1]*q/L)]+=1
dst_hs_hist=dst_hs_hist/(dst_width*dst_height)
마지막으로 타겟의 HSI 영역에서 히스토그램을 역투영하면 얼굴과 유사한 영역이 검출된다.
dst = np.zeros([dst_height,dst_width])
for y in range(dst_height):
    for x in range(dst_width):
        h=int(dst_hsi[y, x,0] * q / L)
        s=int(dst_hsi[y,x,1]*q/L)
        dst[y][x]=np.clip(hs_hist[h,s]/dst_hs_hist[h,s],0,1)*255

plt.subplot(121)
plt.imshow(cv2.cvtColor(img2,cv2.COLOR_BGR2RGB))
plt.subplot(122)
plt.imshow(dst, cmap='gray')
plt.show()
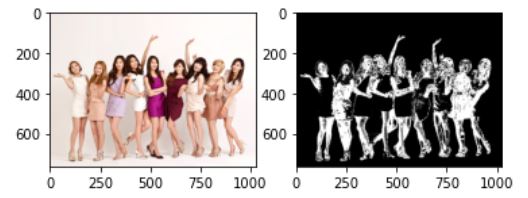
OpenCV에서는 q를 사용하지는 않고 간단하게 구할 수 있다. OpenCV에서는 RGB2HSI가 지원되지 않는다. 따라서 HSV를 이용해 구현을 한다. (HSI와 HSV의 수식이 조금 달라서 값이 조금 차이가 난다.)
cv_hsv = cv2.cvtColor(img,cv2.COLOR_BGR2HSV)
cv_hsv2 = cv2.cvtColor(img2,cv2.COLOR_BGR2HSV)


cv_hs_hist = cv2.calcHist([cv_hsv], [0,1], None, [180,256], [0,180,0, 256])
cv2.normalize(cv_hs_hist,cv_hs_hist,0,255,cv2.NORM_MINMAX)
cv_dst=cv2.calcBackProject([cv_hsv2],[0,1], cv_hs_hist,[0,180,0,256],1) # 역투영함수
disc = cv2.getStructuringElement(cv2.MORPH_ELLIPSE,(5,5)) # smooding mask
cv2.filter2D(cv_dst,-1,disc,cv_dst) # smoothing

plt.subplot(121)
plt.imshow(cv2.cvtColor(img2,cv2.COLOR_BGR2RGB))
plt.subplot(122)
plt.imshow(cv_dst, cmap='gray')
plt.show()
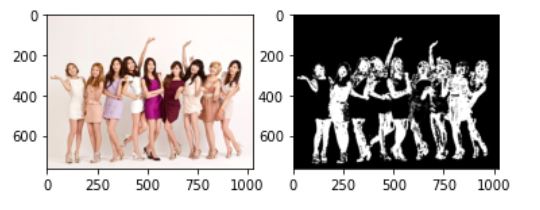
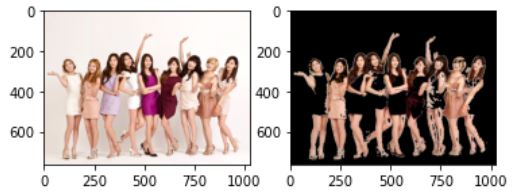
추가적으로 검출된 영역을 다음과 같이 하면 검출 영역의 색상을 띄우는 것이 가능하다.
_,thr = cv2.threshold(cv_dst,5,255,0)
thr = cv2.merge((thr,thr,thr))
cv_dst = cv2.bitwise_and(img2,thr)

plt.subplot(121)
plt.imshow(cv2.cvtColor(img2,cv2.COLOR_BGR2RGB))
plt.subplot(122)
plt.imshow(cv2.cvtColor(cv_dst,cv2.COLOR_BGR2RGB))
plt.show()
Comments